


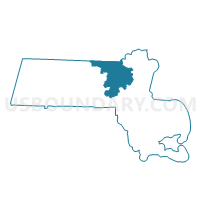
Sudbury town, Middlesex County, Massachusetts
About
Outline

Summary
| Unique Area Identifier | 134177 |
| Name | Sudbury town |
| County | Middlesex County |
| State | Massachusetts |
| Area (square miles) | 24.75 |
| Land Area (square miles) | 24.27 |
| Water Area (square miles) | 0.48 |
| % of Land Area | 98.06 |
| % of Water Area | 1.94 |
| Latitude of the Internal Point | 42.38336740 |
| Longtitude of the Internal Point | -71.42107040 |
| Total Population | 17,659 |
| Total Housing Units | 5,951 |
| Total Households | 5,771 |
| Median Age | 42.5 |
Maps

Graphs
Select a template below for downloading or customizing gragh for Sudbury town, Middlesex County, Massachusetts


Neighbors
Neighoring County Subdivision (by Name) Neighboring County Subdivision on the Map
- Acton town, Middlesex County, MA
- Concord town, Middlesex County, MA
- Framingham town, Middlesex County, MA
- Hudson town, Middlesex County, MA
- Lincoln town, Middlesex County, MA
- Marlborough city, Middlesex County, MA
- Maynard town, Middlesex County, MA
- Stow town, Middlesex County, MA
- Wayland town, Middlesex County, MA
Top 10 Neighboring Place (by Population) Neighboring Place on the Map
- Framingham CDP, MA (68,318)
- Marlborough city, MA (38,499)
- Maynard CDP, MA (10,106)
- West Concord CDP, MA (6,028)
Top 10 Neighboring Elementary School District (by Population) Neighboring Elementary School District on the Map
- Acton School District, MA (21,924)
- Concord School District, MA (17,668)
- Sudbury School District, MA (17,659)
- Lincoln School District, MA (6,362)
Top 10 Neighboring Secondary School District (by Population) Neighboring Secondary School District on the Map
- Acton-Boxborough School District, MA (26,920)
- Lincoln-Sudbury School District, MA (24,021)
- Concord-Carlisle School District, MA (22,520)
Top 10 Neighboring Unified School District (by Population) Neighboring Unified School District on the Map
- Framingham School District, MA (68,318)
- Marlborough School District, MA (38,499)
- Nashoba School District, MA (19,542)
- Hudson School District, MA (19,063)
- Wayland School District, MA (12,994)
- Maynard School District, MA (10,106)
Top 10 Neighboring State Legislative District Lower Chamber (by Population) Neighboring State Legislative District Lower Chamber on the Map
- Fourth Middlesex District, MA (44,801)
- Thirty-Seventh Middlesex District, MA (43,412)
- Fourteenth Middlesex District, MA (41,201)
- Sixth Middlesex District, MA (41,183)
- Third Middlesex District, MA (40,656)
- Thirteenth Middlesex District, MA (37,015)
Top 10 Neighboring State Legislative District Upper Chamber (by Population) Neighboring State Legislative District Upper Chamber on the Map
- Middlesex & Worcester District, MA (173,533)
- Norfolk, Bristol & Middlesex District, MA (169,111)
- Third Middlesex District, MA (165,996)
- Second Middlesex & Norfolk District, MA (165,418)
Top 10 Neighboring 111th Congressional District (by Population) Neighboring 111th Congressional District on the Map
- Congressional District 3, MA (664,919)
- Congressional District 5, MA (662,269)
- Congressional District 7, MA (648,162)
Top 10 Neighboring Census Tract (by Population) Neighboring Census Tract on the Map
- Census Tract 3651, Middlesex County, MA (7,732)
- Census Tract 3839.01, Middlesex County, MA (7,628)
- Census Tract 3211, Middlesex County, MA (6,992)
- Census Tract 3231, Middlesex County, MA (6,590)
- Census Tract 3631.04, Middlesex County, MA (6,105)
- Census Tract 3612, Middlesex County, MA (5,765)
- Census Tract 3611, Middlesex County, MA (5,657)
- Census Tract 3652.01, Middlesex County, MA (5,607)
- Census Tract 3838, Middlesex County, MA (5,360)
- Census Tract 3602, Middlesex County, MA (5,076)
Top 10 Neighboring 5-Digit ZIP Code Tabulation Area (by Population) Neighboring 5-Digit ZIP Code Tabulation Area on the Map
- 01752, MA (38,499)
- 01701, MA (31,217)
- 01720, MA (21,361)
- 01749, MA (19,063)
- 01742, MA (17,726)
- 01776, MA (17,659)
- 01778, MA (13,109)
- 01754, MA (10,106)
- 01775, MA (6,590)
- 01773, MA (5,112)
Data
Demographic, Population, Households, and Housing Units
** Data sources from census 2010 **
Show Data on Map
Download Full List as CSV
Download Quick Sheet as CSV
| Subject | This Area | Middlesex County | Massachusetts | National |
|---|---|---|---|---|
| POPULATION | ||||
| Total Population Map | 17,659 | 1,503,085 | 6,547,629 | 308,745,538 |
| POPULATION, HISPANIC OR LATINO ORIGIN | ||||
| Not Hispanic or Latino Map | 17,309 | 1,404,735 | 5,919,975 | 258,267,944 |
| Hispanic or Latino Map | 350 | 98,350 | 627,654 | 50,477,594 |
| POPULATION, RACE | ||||
| White alone Map | 16,036 | 1,202,411 | 5,265,236 | 223,553,265 |
| Black or African American alone Map | 149 | 70,021 | 434,398 | 38,929,319 |
| American Indian and Alaska Native alone Map | 9 | 2,571 | 18,850 | 2,932,248 |
| Asian alone Map | 1,041 | 139,943 | 349,768 | 14,674,252 |
| Native Hawaiian and Other Pacific Islander alone Map | 9 | 487 | 2,223 | 540,013 |
| Some Other Race alone Map | 99 | 49,410 | 305,151 | 19,107,368 |
| Two or More Races Map | 316 | 38,242 | 172,003 | 9,009,073 |
| POPULATION, SEX | ||||
| Male Map | 8,617 | 730,864 | 3,166,628 | 151,781,326 |
| Female Map | 9,042 | 772,221 | 3,381,001 | 156,964,212 |
| POPULATION, AGE (18 YEARS) | ||||
| 18 years and over Map | 12,011 | 1,182,646 | 5,128,706 | 234,564,071 |
| Under 18 years | 5,648 | 320,439 | 1,418,923 | 74,181,467 |
| POPULATION, AGE | ||||
| Under 5 years | 999 | 85,671 | 367,087 | 20,201,362 |
| 5 to 9 years | 1,675 | 87,493 | 385,687 | 20,348,657 |
| 10 to 14 years | 1,905 | 90,446 | 405,613 | 20,677,194 |
| 15 to 17 years | 1,069 | 56,829 | 260,536 | 12,954,254 |
| 18 and 19 years | 313 | 41,544 | 202,220 | 9,086,089 |
| 20 years | 89 | 19,361 | 101,248 | 4,519,129 |
| 21 years | 65 | 19,361 | 96,372 | 4,354,294 |
| 22 to 24 years | 275 | 63,024 | 278,048 | 12,712,576 |
| 25 to 29 years | 313 | 113,746 | 441,525 | 21,101,849 |
| 30 to 34 years | 418 | 104,578 | 403,616 | 19,962,099 |
| 35 to 39 years | 967 | 102,073 | 418,195 | 20,179,642 |
| 40 to 44 years | 1,515 | 110,945 | 468,954 | 20,890,964 |
| 45 to 49 years | 1,923 | 120,213 | 515,434 | 22,708,591 |
| 50 to 54 years | 1,682 | 112,788 | 497,001 | 22,298,125 |
| 55 to 59 years | 1,319 | 96,663 | 432,822 | 19,664,805 |
| 60 and 61 years | 414 | 34,552 | 156,594 | 7,113,727 |
| 62 to 64 years | 563 | 46,783 | 213,953 | 9,704,197 |
| 65 and 66 years | 310 | 24,585 | 114,758 | 5,319,902 |
| 67 to 69 years | 396 | 32,433 | 149,701 | 7,115,361 |
| 70 to 74 years | 488 | 42,739 | 192,001 | 9,278,166 |
| 75 to 79 years | 392 | 36,319 | 162,592 | 7,317,795 |
| 80 to 84 years | 274 | 30,183 | 138,473 | 5,743,327 |
| 85 years and over | 295 | 30,756 | 145,199 | 5,493,433 |
| MEDIAN AGE BY SEX | ||||
| Both sexes Map | 42.50 | 38.50 | 39.10 | 37.20 |
| Male Map | 42.10 | 37.10 | 37.70 | 35.80 |
| Female Map | 42.90 | 39.80 | 40.30 | 38.50 |
| HOUSEHOLDS | ||||
| Total Households Map | 5,771 | 580,688 | 2,547,075 | 116,716,292 |
| HOUSEHOLDS, HOUSEHOLD TYPE | ||||
| Family households: Map | 4,946 | 366,656 | 1,603,591 | 77,538,296 |
| Husband-wife family Map | 4,425 | 287,332 | 1,178,690 | 56,510,377 |
| Other family: Map | 521 | 79,324 | 424,901 | 21,027,919 |
| Male householder, no wife present Map | 104 | 20,754 | 106,657 | 5,777,570 |
| Female householder, no husband present Map | 417 | 58,570 | 318,244 | 15,250,349 |
| Nonfamily households: Map | 825 | 214,032 | 943,484 | 39,177,996 |
| Householder living alone Map | 684 | 161,516 | 732,263 | 31,204,909 |
| Householder not living alone Map | 141 | 52,516 | 211,221 | 7,973,087 |
| HOUSEHOLDS, HISPANIC OR LATINO ORIGIN OF HOUSEHOLDER | ||||
| Not Hispanic or Latino householder: Map | 5,683 | 552,536 | 2,363,312 | 103,254,926 |
| Hispanic or Latino householder: Map | 88 | 28,152 | 183,763 | 13,461,366 |
| HOUSEHOLDS, RACE OF HOUSEHOLDER | ||||
| Householder who is White alone | 5,380 | 488,001 | 2,141,886 | 89,754,352 |
| Householder who is Black or African American alone | 48 | 24,192 | 150,977 | 14,129,983 |
| Householder who is American Indian and Alaska Native alone | 3 | 855 | 6,454 | 939,707 |
| Householder who is Asian alone | 284 | 43,095 | 109,022 | 4,632,164 |
| Householder who is Native Hawaiian and Other Pacific Islander alone | 4 | 147 | 684 | 143,932 |
| Householder who is Some Other Race alone | 16 | 14,922 | 93,230 | 4,916,427 |
| Householder who is Two or More Races | 36 | 9,476 | 44,822 | 2,199,727 |
| HOUSEHOLDS, HOUSEHOLD TYPE BY HOUSEHOLD SIZE | ||||
| Family households: Map | 4,946 | 366,656 | 1,603,591 | 77,538,296 |
| 2-person household Map | 1,623 | 145,271 | 646,935 | 31,882,616 |
| 3-person household Map | 1,070 | 90,005 | 389,107 | 17,765,829 |
| 4-person household Map | 1,482 | 81,758 | 342,062 | 15,214,075 |
| 5-person household Map | 602 | 33,432 | 147,354 | 7,411,997 |
| 6-person household Map | 136 | 10,596 | 50,366 | 3,026,278 |
| 7-or-more-person household Map | 33 | 5,594 | 27,767 | 2,237,501 |
| Nonfamily households: Map | 825 | 214,032 | 943,484 | 39,177,996 |
| 1-person household Map | 684 | 161,516 | 732,263 | 31,204,909 |
| 2-person household Map | 126 | 39,976 | 166,231 | 6,360,012 |
| 3-person household Map | 9 | 7,902 | 28,109 | 992,156 |
| 4-person household Map | 1 | 3,250 | 11,614 | 411,171 |
| 5-person household Map | 4 | 961 | 3,488 | 126,634 |
| 6-person household Map | 0 | 252 | 1,043 | 48,421 |
| 7-or-more-person household Map | 1 | 175 | 736 | 34,693 |
| HOUSING UNITS | ||||
| Total Housing Units Map | 5,951 | 612,004 | 2,808,254 | 131,704,730 |
| HOUSING UNITS, OCCUPANCY STATUS | ||||
| Occupied Map | 5,771 | 580,688 | 2,547,075 | 116,716,292 |
| Vacant Map | 180 | 31,316 | 261,179 | 14,988,438 |
| HOUSING UNITS, OCCUPIED, TENURE | ||||
| Owned with a mortgage or a loan Map | 4,070 | 268,147 | 1,177,473 | 52,979,430 |
| Owned free and clear Map | 1,257 | 92,942 | 409,685 | 23,006,644 |
| Renter occupied Map | 444 | 219,599 | 959,917 | 40,730,218 |
| HOUSING UNITS, VACANT, VACANCY STATUS | ||||
| For rent Map | 14 | 13,353 | 66,673 | 4,137,567 |
| Rented, not occupied Map | 4 | 835 | 3,822 | 206,825 |
| For sale only Map | 83 | 4,803 | 25,038 | 1,896,796 |
| Sold, not occupied Map | 11 | 1,257 | 6,408 | 421,032 |
| For seasonal, recreational, or occasional use Map | 30 | 3,525 | 115,630 | 4,649,298 |
| For migrant workers Map | 0 | 17 | 161 | 24,161 |
| Other vacant Map | 38 | 7,526 | 43,447 | 3,652,759 |
| HOUSING UNITS, OCCUPIED, AVERAGE HOUSEHOLD SIZE BY TENURE | ||||
| Total: Map | 3.02 | 2.49 | 2.48 | 2.58 |
| Owner occupied Map | 3.10 | 2.70 | 2.66 | 2.65 |
| Renter occupied Map | 2.12 | 2.15 | 2.18 | 2.44 |
| HOUSING UNITS, OCCUPIED, TENURE BY RACE OF HOUSEHOLDER | ||||
| Owner occupied: Map | 5,327 | 361,089 | 1,587,158 | 75,986,074 |
| Householder who is White alone Map | 4,977 | 324,611 | 1,443,462 | 63,446,275 |
| Householder who is Black or African American alone Map | 30 | 7,109 | 50,643 | 6,261,464 |
| Householder who is American Indian and Alaska Native alone Map | 3 | 327 | 2,233 | 509,588 |
| Householder who is Asian alone Map | 280 | 22,618 | 54,010 | 2,688,861 |
| Householder who is Native Hawaiian and Other Pacific Islander alone Map | 2 | 43 | 248 | 61,911 |
| Householder who is Some Other Race alone Map | 4 | 3,012 | 20,485 | 1,975,817 |
| Householder who is Two or More Races Map | 31 | 3,369 | 16,077 | 1,042,158 |
| Renter occupied: Map | 444 | 219,599 | 959,917 | 40,730,218 |
| Householder who is White alone Map | 403 | 163,390 | 698,424 | 26,308,077 |
| Householder who is Black or African American alone Map | 18 | 17,083 | 100,334 | 7,868,519 |
| Householder who is American Indian and Alaska Native alone Map | 0 | 528 | 4,221 | 430,119 |
| Householder who is Asian alone Map | 4 | 20,477 | 55,012 | 1,943,303 |
| Householder who is Native Hawaiian and Other Pacific Islander alone Map | 2 | 104 | 436 | 82,021 |
| Householder who is Some Other Race alone Map | 12 | 11,910 | 72,745 | 2,940,610 |
| Householder who is Two or More Races Map | 5 | 6,107 | 28,745 | 1,157,569 |
| HOUSING UNITS, OCCUPIED, TENURE BY HISPANIC OR LATINO ORIGIN OF HOUSEHOLDER | ||||
| Owner occupied: Map | 5,327 | 361,089 | 1,587,158 | 75,986,074 |
| Not Hispanic or Latino householder Map | 5,254 | 353,114 | 1,541,505 | 69,617,625 |
| Hispanic or Latino householder Map | 73 | 7,975 | 45,653 | 6,368,449 |
| Renter occupied: Map | 444 | 219,599 | 959,917 | 40,730,218 |
| Not Hispanic or Latino householder Map | 429 | 199,422 | 821,807 | 33,637,301 |
| Hispanic or Latino householder Map | 15 | 20,177 | 138,110 | 7,092,917 |
| HOUSING UNITS, OCCUPIED, TENURE BY HOUSEHOLD SIZE | ||||
| Owner occupied: Map | 5,327 | 361,089 | 1,587,158 | 75,986,074 |
| 1-person household Map | 486 | 73,180 | 337,783 | 16,453,569 |
| 2-person household Map | 1,629 | 120,101 | 547,166 | 27,618,605 |
| 3-person household Map | 1,037 | 65,125 | 276,048 | 12,517,563 |
| 4-person household Map | 1,429 | 64,580 | 261,809 | 10,998,793 |
| 5-person household Map | 586 | 26,175 | 110,229 | 5,057,765 |
| 6-person household Map | 127 | 8,004 | 36,086 | 1,965,796 |
| 7-or-more-person household Map | 33 | 3,924 | 18,037 | 1,373,983 |
| Renter occupied: Map | 444 | 219,599 | 959,917 | 40,730,218 |
| 1-person household Map | 198 | 88,336 | 394,480 | 14,751,340 |
| 2-person household Map | 120 | 65,146 | 266,000 | 10,624,023 |
| 3-person household Map | 42 | 32,782 | 141,168 | 6,240,422 |
| 4-person household Map | 54 | 20,428 | 91,867 | 4,626,453 |
| 5-person household Map | 20 | 8,218 | 40,613 | 2,480,866 |
| 6-person household Map | 9 | 2,844 | 15,323 | 1,108,903 |
| 7-or-more-person household Map | 1 | 1,845 | 10,466 | 898,211 |
Loading...